HomeProjectsPeopleToolsDownloadsPublicationsGalleryEducationLinks
  Home > Projects > Adriatic Circulation Experiment > June 2003 Field Report

ACTIVE PROJECTS


Dolce Vita 2—June 2003 Field Report
filed by Dr. Craig Lee on 10 June 2003
Summary Feb 2003 Field Report June 2003 Field Report Science Party

The Dolce Vita 2 cruise tracks
Figure 1. Cruise tracks as of 10 June 2003.
MODIS ocean color image
Figure 2. A MODIS ocean color image (provided by NRL- Stennis Space Center) from 7 June 2003.
A section across the Istria front
Figure 3. A section across the Istria front, running north to south. Data have not been lag-corrected, and hysteresis (SP?) is thus apparent in all sensors. Note the strong salinity front and the numerous small-scale interleaving features.
curtain plot of the difference between optical absorption at 676 nm and 650 nm
Figure 4. A curtain plot of the difference between optical absorption at 676 nm and 650 nm during the first Jabuka radiator in the region of the Mid-Adriatic Filament. This difference is correlated with chlorophyll concentration. Most obvious is the subsurface maximum present throughout the region at 75 meters depth. Significant horizontal patchiness also exist in this layer. At the northern rim of the Pit, the chlorophyll maximum becomes diffuse and reorganizes north of the rim.
A curtain plot of optical attenuation at 650 nm in the Po River plume.
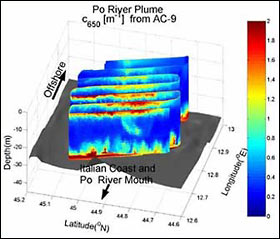
Figure 5. A curtain plot of optical attenuation at 650 nm in the Po River plume. The viewing perspective is looking from the Italian toward Istria, Croatia. At the surface there is a thin layer of high attenuation indicative of high levels of suspended particulate material. This layer thins, narrows and decreases in attenuation progressing offshore. Also, in the first leg near the center of the leg, particles can be seen beneath the surface layer, apparently falling from the surface.
hydrographic section
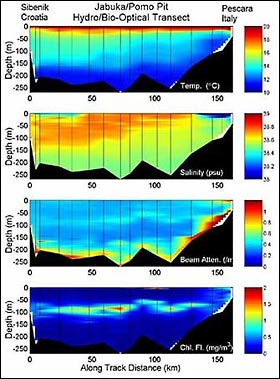
Figure 6. The hydrographic section showing temperature, salinity, beam attenuation and chlorophyll fluorescence extending from near the Croatian town of Sibenik westward toward the Italian town of Pescara. As in Figure 4, the subsurface chlorophyll maximum is pronounced. The influence of the Po River plume can be seen in the low salinity, high chlorophyll near surface band near the Italian coast.
The R/V Knorr sailed from Ancona, Italy on 26 June with a team of scientists from American, Italian, Croatian, and Austrian institutions. In contrast to the wintertime study of response to strong atmospheric forcing, springtime investigations focused on a period when riverine buoyancy flux (the spring freshette) normally dominates the northern and central Adriatic. As before, we utilized near-real time remotely sensed sea surface temperature and ocean color (provided by the Ocean Color Group at NRL Stennis Space Center and the Remote Sensing Group at OGS-Trieste) to direct sampling toward specific fronts and filaments (Figure 1). Specialized meteorological forecasts were provided by Dietmar Thaler (Austrian Military Weather Service) and Dr. Vlasta Tutis (Croatian Meteorological Service). This continuous information stream allowed us to refine sampling strategies and focus effectively on rapidly evolving mesoscale variability.

Sunrise in the Adriatic
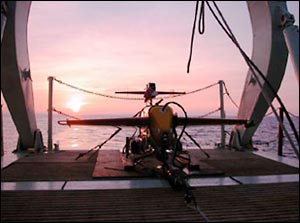
Sunrise in the Adriatic.

Forcing during the spring measurement period has been weak to non-existent. Climatologically, we expected to sample during the spring freshette, but recent data (supplied by Nello Russo, Univ. of Ancona, shortly after we sailed) place the discharge strength at approximately 30% of normal (for the spring freshette). Likewise, wind forcing has been extremely weak. We experienced a (weak) Sirocco about one week into the cruise, but for the most part it has been so calm that the sea is like glass. As expected, the entire basin is stratified, with very shallow (0-5 m) mixed layers and significant stratification throughout the water column. The upshot is that, without strong forcing to organize the circulation, we've been sampling weak, small scale flows dominated by internal dynamics. One striking find was the presence of small-scale T-S interleaving features in many parts of the basin.

We began with a couple of sections across the northern basin to shake out the various instruments and to scout the 'Istria front' (Figure 2). Remotely sensed SST provides little information this time of year, as the entire basin is surface capped. Ocean color is a bit better, though the Po plume dominates the variability. The April/May SACLANTCEN/NRL cruise found a subsurface front at the same location where we observed the 'Istria front' last winter, though the feature was considerably weaker. We observed a weak front in this region (Figure 3), probably formed by a filament of cooler water extending from Kvarner Bay.

preparing TriSoarus for deployment
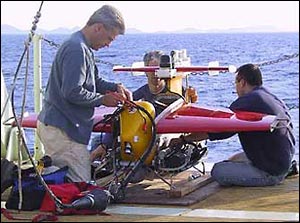
Tim McGinnis, Eric Boget and Jason Gobat preparing TriSoarus for deployment.

Similar to wintertime conditions, the Mid-Adriatic Filament (MAF) did not appear in the remote sensing, though previous studies suggested that it might be present. We executed a 24-hour survey over the Jabuka Pit which revealed a distinct westward current (the MAF?) embedded in an energetic, highly variable flow field. The MAF turned westward while still over deep water, well before the bathymetry shoaled. Pierre's drifters and our own data suggest that inertial motions may be significant. With only weak wind forcing this seems a little odd, though even weak winds may be sufficient to accelerate the extremely thin surface layer. Given the potential importance of inertial motions and our concerns that the lateral scales might be quite small, we executed a rapidly repeated survey (~6 hours each with 6 occupations) spanning the MAF. This should allow us to assess MAF dynamics and provide a rough characterization of inertial variability. Within this region the optical distribution was characteristic of a seasonal subsurface chlorophyll maximum at about 75 meters (Figure 4), as well as a deep non-phytoplankton particle and CDOM layer apparently associated with northern Adriatic deep water formed during the winter. We also occupied a section running through the deepest regions of the Jabuka Pit, in an attempt to investigate the paths followed by North Adriatic Deep Water (Figure 6).

contrast in surface waters
A contrast in surface waters—on the eastern side of the basin, clear, blue water and near the Po delta (western side) surface waters were green and murky, a combination of high phytoplankton content and suspended inorganic material.

Following this, we transited to the Istrian coast, where we sampled the remnants of a filament that had extended from Kvarner Bay. Though there was a clear salinity front accompanied by optical variability (Figure 3), we couldn't avoid comparisons with the dramatic front we sampled here during the previous winter. There were weak increases in optical signals north of the front with both higher absolute absorption and also higher absorption/attenuation ratios indicative of increased phytoplankton abundance. However, throughout the area both attenuation and CDOM fluorescence increased near-bottom indicating a layer of elevated particle and CDOM concentrations.

Over the past few days, we've been working at the mouth of the Po, studying the outflow region during a period of weak discharge. Sampling has included two orthogonally-oriented TriSoarus surveys and an intensive daytime section of CTDs and optical profiles. The attenuation at 650 nm from the first Po survey is shown in Figure 5. Next, we intend to run an extended pattern, executing cross-shelf TriSoarus sections between the Po Delta and the Jabuka Pit. During this period, we will choose an instability somewhere along the Po plume (the best candidate at this time is a pair of filaments extending over the Jabuka Pit) for a final, focused three-day study.


^ top